
Written by David James “DJ” Smith, Jr.
Applications Engineer, Scantek
The 500 Hz Shortcut
There’s a note in ISO 9613-2 that doesn’t get nearly enough attention. If you’ve ever stared at your noise model software wondering what to do when you have no spectral data, it might just be your new best friend.
First, a quick recap of how ISO 9613-2 is supposed to work
In an ideal world, you, the end-user who is about to start your noise modelling project, have octave-band sound power levels for your source, 63 Hz through 8 kHz. Attenuation calculations are ran separately for each band. Air absorption, ground effect, barriers, screening; all of it, band by band. After that 1) an A-weighting is applied, 2) the bands are summed, and 3) you arrive at a receiver level that you can trust.
That’s the full method. It’s thorough, it’s accurate, and it assumes you have the data to do it properly. But…what if you don’t?
Maybe you’re in early-stage assessment. Maybe the equipment manufacturer handed you a single A-weighted figure and called it a day. Whatever the reason, you’ve got one A-weighted decibel level and no spectrum.
The authors of the industrial noise standard, ISO 9613-2 anticipated this. It includes a note, shown below, that permits you to approximate the total attenuation using the propagation terms for the 500 Hz octave band alone, applied directly to your overall dB(A) level.

One band. One calculation. Done.
Why 500 Hz specifically?
It’s not arbitrary. In fact, there are several reasons why 500 Hz can be an ideal band for representing your source’s overall sound spectrum. I’ve tried to find hard data explaining exactly why 500 Hz is used for this purpose, and I’ve asked several experts along the way. So far, no one seems to know the definitive reason, but I’ve found a few explanations that help shed some light on it.
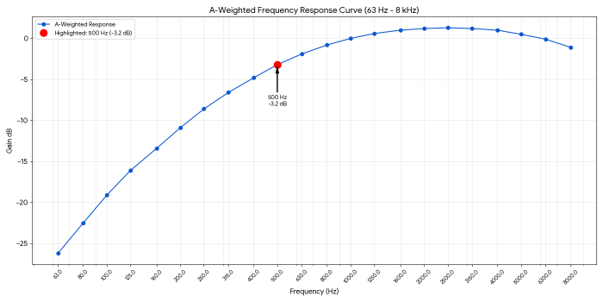
500 Hz sits near the peak sensitivity of the A-weighting curve, making it a reasonable proxy for the mid-band behavior of most broadband industrial noise sources. It won’t be perfect for every source, but for a typical fan, compressor, HVAC unit (source in-general), it’s the best place to start.
Another reason is atmospheric absorption. As you increase in frequency, the absorption coefficient increases rapidly. Below 500Hz, atmospheric absorption is relatively minimal. This is the same reason, or at least part of the reason, that sounds from far away tend to sound dull or muffled. There are a lot of different parameters to look at here, but one of the most important atmospheric factors is humidity. Humidity plays a huge role in how sound is absorbed by the atmosphere. The chart below shows how dramatic this change is.
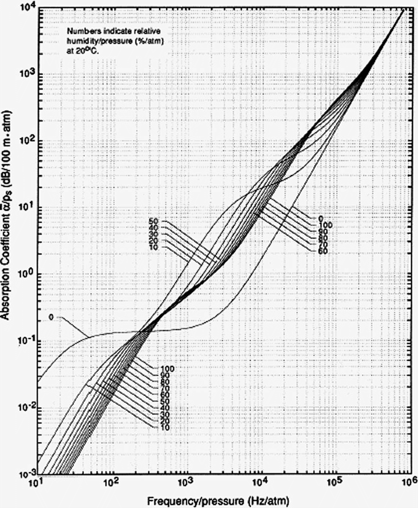
Garrett, Steven. (2020). Attenuation of Sound. 10.1007/978-3-030-44787-8_14.
Selecting a single frequency band to represent an entire sound spectrum will never be 100% accurate. The authors who selected 500Hz likely considered it a reasonable compromise, high enough to account for some atmospheric absorption, but low enough that the absorption is not yet excessive. In other words, 500 Hz provides a practical middle ground for representing the behavior of a broadband source.
The last reason, and maybe the most important as to why we see this in today, is the history of the standards themselves. The current ISO 9613 standards, including ISO 9613-1:1993 and ISO 9613-2:2024, have their roots in the German standard VDI 2714. The use of 500 Hz as a representative frequency was adopted through these new ISO sstandards, which helps explain why it remains part of modern environmental noise calculations.
In VDI 2714, Note 1 of Chapter 5 the standard reads:
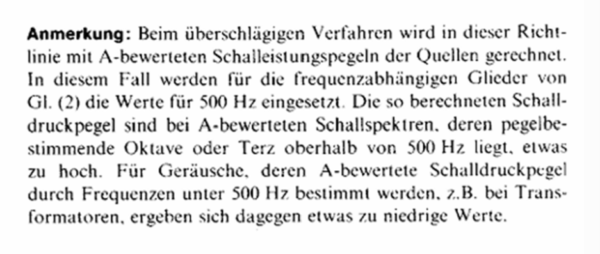
This translates to:
“Note: In the simplified method used in this guideline, calculations are performed using the A-weighted sound power levels of the sources. In this case, the values for 500 Hz are used for the frequency-dependent terms of Eq. (2).
The sound pressure levels calculated in this manner are slightly too high for A-weighted sound spectra whose level-determining octave or third-octave band lies above 500 Hz. Conversely, for noises whose A-weighted sound pressure levels are determined by frequencies below 500 Hz—for example, in the case of transformers—the resulting values are slightly too low.”
What does the 500Hz Shortcut look like in practice?
Let’s say you have a source that is 95dBA. ISO 9613-2 will calculate geometric spreading, ground attenuation, barrier insertion loss, and air absorption as if everything were happening at 500 Hz. Add all this up, subtract from 95 and that’s your estimated receiver sound pressure level. Simple and fast.
Here is the ISO 9613-2 sound propagation equation:
Lp,f(R)=Lw,f+Dc,f−Adiv−Aatm,f−Agr,f−Abar,f−Amisc,f
- Lp,f(R): sound pressure level at the receiver (dB)
- Lw,f: sound power level of the source (dB)
- Dc,f: directivity correction (dB)
- Adiv: geometric divergence (spherical spreading) (dB)
- Aatm,f: atmospheric absorption for band, f (dB)
- Agr,f: ground effect attenuation (dB)
- Abar,f: barrier/screen attenuation (dB)
- Amisc,f: any additional attenuations (e.g. foliage, etc.) (dB)
It’s important to reiterate that this is an approximation. It’s less accurate than running the full octave-band calculation where each band is calculated and evaluated individually. For compliance assessments or highly detailed, impactful work, the full method should always be the default. But for screening, scoping, or situations where the data simply doesn’t exist yet? The 500 Hz shortcut is there for a reason.